Important information: The value of investments and any income derived from them may go down as well as up. You may not get back the amount originally invested. Past performance is not a reliable indicator of future results.
We often talk about bonds, the inverse relationship between yields and prices, and duration. This week, we thought we’d explain some of these concepts and ideas and how it informs our portfolio construction. Apologies in advance if we’re teaching you to suck eggs.
The inverse relationship
Imagine you hold a UK government bond with a 3% coupon (the amount it pays out per annum). Now let’s say interest rates go up from 3% to 5%, so now the government, instead of issuing bonds with a 3% coupon, starts selling them with a 5% coupon. What’s going to happen to the value of your bond with the 3% coupon? It’s going to go down as it’s now less valuable, offering a less competitive yield – who would want 3% when you can get 5% on the same instrument. The opposite is equally true. If rates were cut from 3% to 1%, your 3% bond is now a lot more valuable. So, this is why we say bond prices move in the opposite direction to bond yields.
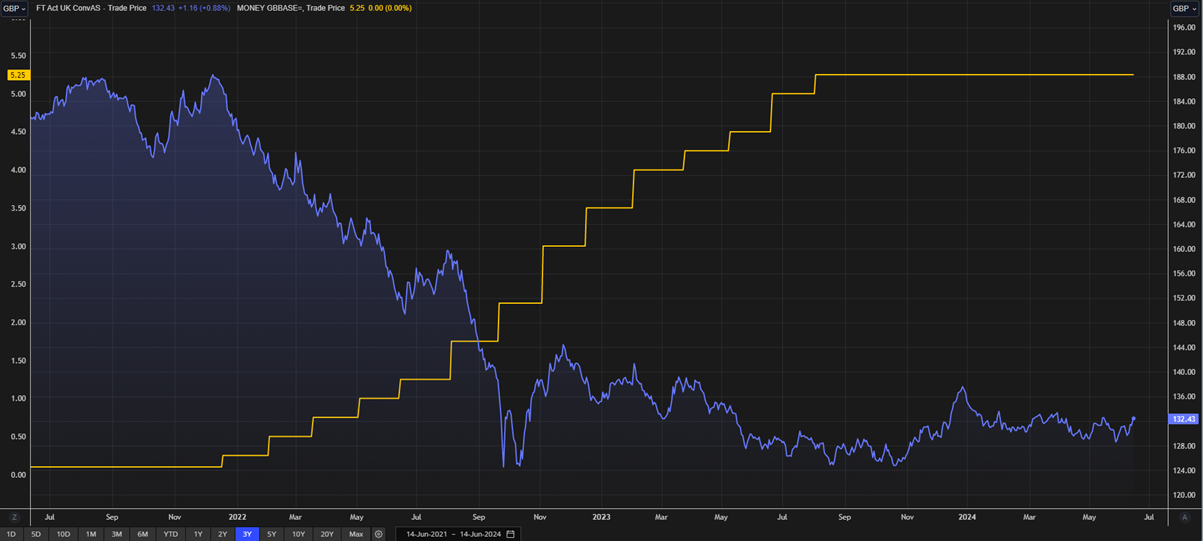
2022 and 2023 provide a great real-world example of this in action as it was one of the steepest rate hiking cycles in 40 years. In the below chart, the yellow line is the UK interest rate going from near 0% to over 5% and the blue line is the UK Gilt index. You can see that as rates went up, the value of the gilt market fell. The reverse will be true as rates get cut and we’ve already started seeing it play out this year.