
Important information: The value of investments and any income derived from them may go down as well as up. You may not get back the amount originally invested. Past performance is not a reliable indicator of future results.
Key Takeaways
- US small cap stocks outperformed large caps by 1.7% annually from 1926 to 2022
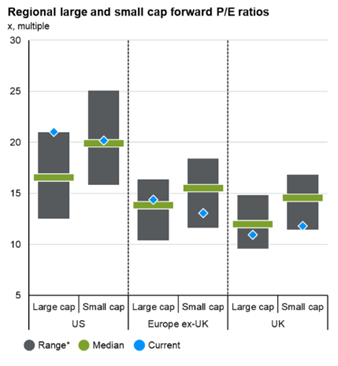
- The current valuation differential between smaller and larger companies is the widest it’s been since 2003
- Global slowdown ending and imminent rate cuts create an opportunity for small caps to outperform once again
- There is an increase in profitless small cap stocks. 45% of the Russell 2000 companies are not generating a profit vs its long-term average of 27%.
- An increased proportion of promising smaller companies are being taken private and unlisted smaller companies are staying private for longer.
- Smaller companies in the US have a greater proportion of their debt at a floating rate (i.e. it varies with interest rates) versus larger companies that have more of their debt at a fixed rate. Specifically, 38% of Russell 2000 debt is floating rate compared to just 7% for the S&P 500.
- Smaller companies also tend to be more leveraged than larger companies as they seek to grow with net debt/EBITDA at 3.2x for the Russell 2000 and 1.6x for the S&P 500.