
India’s GDP grew 7.7% in Fiscal Year 2026 (1 April 2025 to 31 March 2026) [1] and 7.8% in Q1 FY27 (1 April to 30 June 2026).[2]
The Sensex, one of the leading indices in India, fell from a peak of c.86,000 in late November 2025 to a low of c.72,000 by 30 March 2026, recovering to just under 75,000 by 23 September 2026.[3]
Strong domestic investment has reduced reliance on foreign capital. Coupled with strong macroeconomic fundamentals, and despite geopolitical uncertainty, signs point towards more stability in the Indian market.
India has been among the best performing major nations for real GDP growth over the past 5 years, and this is forecast to continue. The IMF projects 6.4% for FY27.[4]
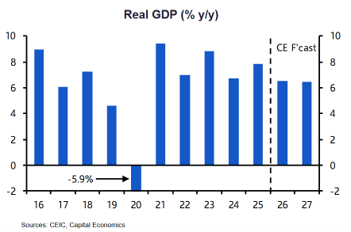
Following weak performance relative to other emerging markets in 2025, the foundation was set for Indian markets to shine in 2026. Morgan Stanley set a December 2026 Sensex target of 107,0005 HSBC 94,000.[6]
Both carried the same caveat: new highs depended on tariffs easing and geopolitics not worsening.
Geopolitics is in part responsible for India’s weaker performance in 2025. Discounted Russian barrels took the Russian component of India’s crude oil intake from under 0.2% before 2022 to 35-40% in 2025.[7] The US retaliated by raising tariffs from 25% to 50%, among the highest of all US trade partners, hitting $87bn of exports and weighing on investor sentiment through 2025.[8]
Donald Trump’s executive order on the 6 February 2026 cut the reciprocal tariff rate to 18% citing an Indian commitment to buy energy products from the US rather than Russia.[9] One might expect this to have been the catalyst for a surge towards those targets.
Yet the Sensex started to tumble. From closing at c84,273 on 10 February, the index fell to below 72,000 by 30 March – a fall of nearly 15%.[10]
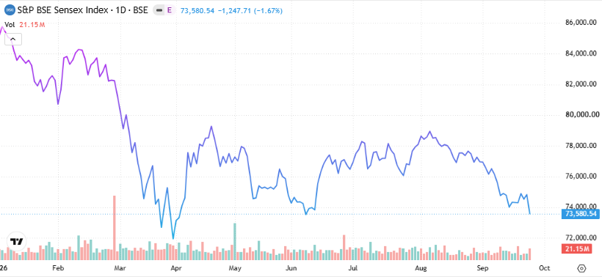
Source: Trading Economics
Foreign investors were already reallocating away from India, selling $14.2bn of Indian equities between February and March.[11] Escalation of the US-Iran conflict then turned a steady outflow into a sell-off. Brent reached $108.23 on 30 March, and the rupee hit record lows, having weakened from roughly ₹85 to ₹96.
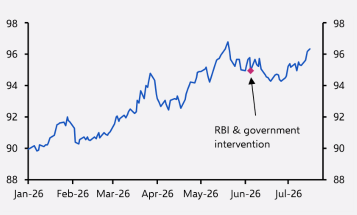
Source: USD/INR, Capital Economics
Topsy Turvy
India took the discount offered by Russian oil, was tariffed for it, negotiated relief, and now faces exposure again. The discount was short term. By March 2026, Russian oil prices were trading at a $1.70 premium to Brent, widening to $6 by 19 March.[12]
There is continued uncertainty with a weak rupee, and the likelihood of rate increases to combat a jump in inflation driven by oil price normalisation, which on one hand would support the currency, but on the other may impact equity valuations. The threat of tariff increases also looms after Trump signed the Graham Act on 18 September[13], giving the administration the power to increase tariffs to 100% for the top five purchasers of Russian oil and gas, of which India is one.
Set against that, three things point in a more positive direction.
Consistent support from domestic institutional investors prevented an even greater sell off and has helped to stabilise the market. Mutual Fund systematic investment plan inflows have run consistently at c₹25,000 crore (c£2bn) per month.[14]
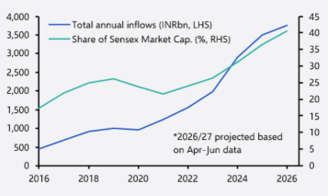
Source: Systematic Investment Plans Contributions, Capital Economics
Secondly, the price to earnings ratio for Indian Equities has fallen back in line with its historic average, having looked stretched leading up to 2025.
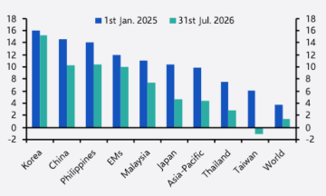
India Valuation Gap Versus Selected MSCI Indices, LSEG, Capital Economics
Finally, strong economic growth suggests the fundamentals are strong. Capital Economics (CE) are bullish on the rupee based on a combination of anticipated interest rate increases; improved terms of trade as oil prices are expected to ease in 2027; and an anticipated rebound in inflows of foreign capital.[15]
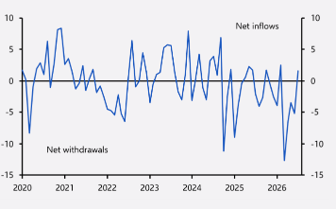
Source: Foreign Portfolio Investors Monthly Investments into Indian Equities (USDbn), Capital Economics
Bowmore portfolios
Bowmore have exposure to India through the Nomura India Equity fund.
Despite being one of the best performing India funds, the fund returned -5.73% over the 12 months to 18 September 2026, reflecting the correction described above. Bowmore allocated in March 2026, close to the low, and the position is up c.5.5% since.[16]
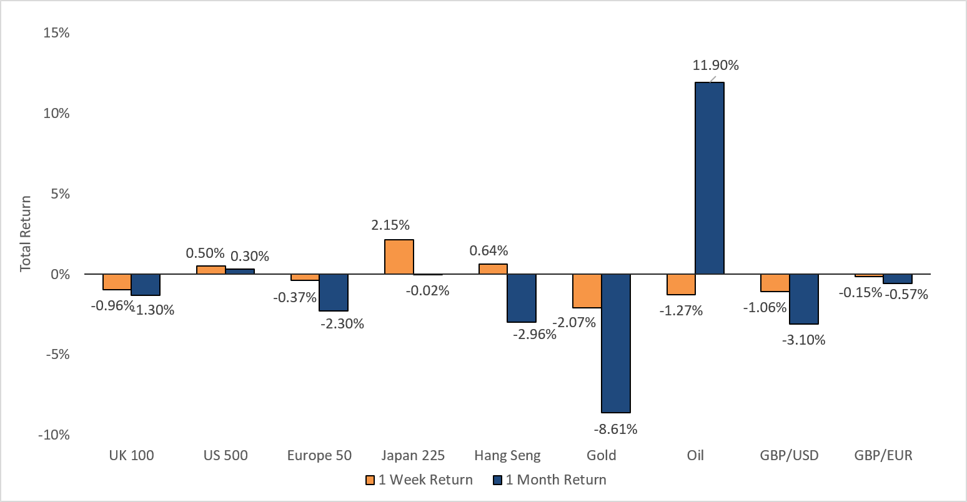
Source: AlphaTerminal, data as at 25/09/2026
The value of your investments can go down as well as up, so you could get back less than you invested. Past performance is not a guide to future performance.
Sources:
1. IMF World Economic Outlook Update, July 2026
2. National Statistical Office, 31 August 2026
3. Share Market, Nifty, Sensex, NSE/BSE Live Updates, Stock Market Today | The Economic Times
4. IMF WEO database
5. Sensex target for 2026 at 107,000? Morgan Stanley makes big prediction - The Economic Times
6. HSBC sees India as way to diversify from crowded AI holdings, sets Sensex target at 94,000 by 2026 end - The Economic Times
7. EXCLUSIVE: Rosneft, Reliance agree biggest ever India-Russia oil supply deal, sources say | Reuters
8. India's exports to US remain unchanged after a year of Trump's tariffs | Economy & Policy News - Business Standard
9. Fact Sheet: The United States and India Announce Historic Trade Deal – The White House
10. Trading Economics
11. Markets Rally, FIIs Exit: What’s Driving the Disconnect? – Outlook Business
12. S&P Global Commodity Insights, 18 March 2026
13.Congressional Bill H.R. 5334 Signed into Law – The White House
14. AMFI monthly SIP data
15. Capital Economics, 3rd August 2026
16. Morningstar, AM Insights